Instagram is a platform with nearly unlimited potential. It can take a brand from anonymity to fame, and it can do the same for an influencer or individual too. If you want your Instagram marketing to be worth your while, though, you need to play the game strategically. It’s all about knowing how to find your target audience, grab their attention, and drive conversions.
Every strategy begins with knowledge, and running a few numbers can help you build your Instagram growth strategy. Check out these statistics about Instagram as well as metrics and statistics of your own to track.
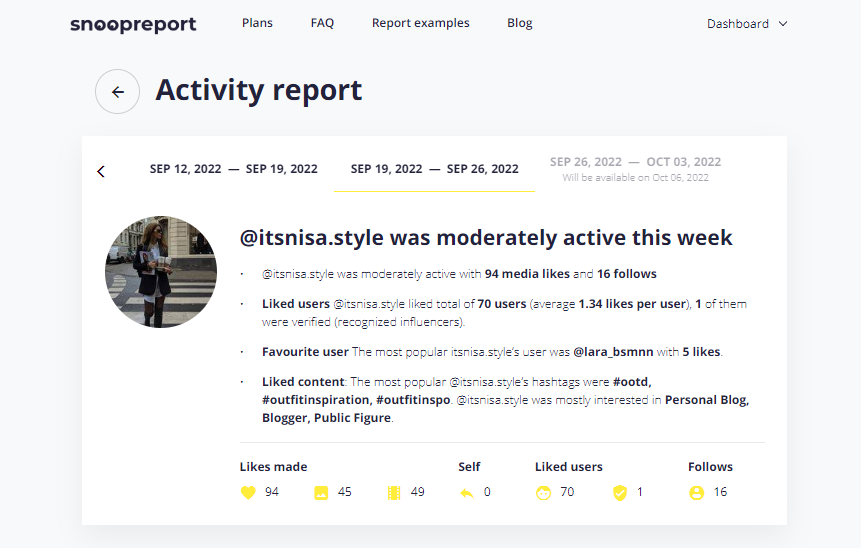
Table of Contents:
- 5 Instagram Platform Statistics You Need to Know
- 5 Instagram Statistics to Track in Your Own Instagram Reports
- Keeping Up with Your Instagram Reports

5 Instagram Platform Statistics You Need to Know
Educating yourself about Instagram as a platform, including who its users are and how to pull in more views, is a critical step toward designing your strategy. Start with these handy insights and statistics from recent Instagram reports.
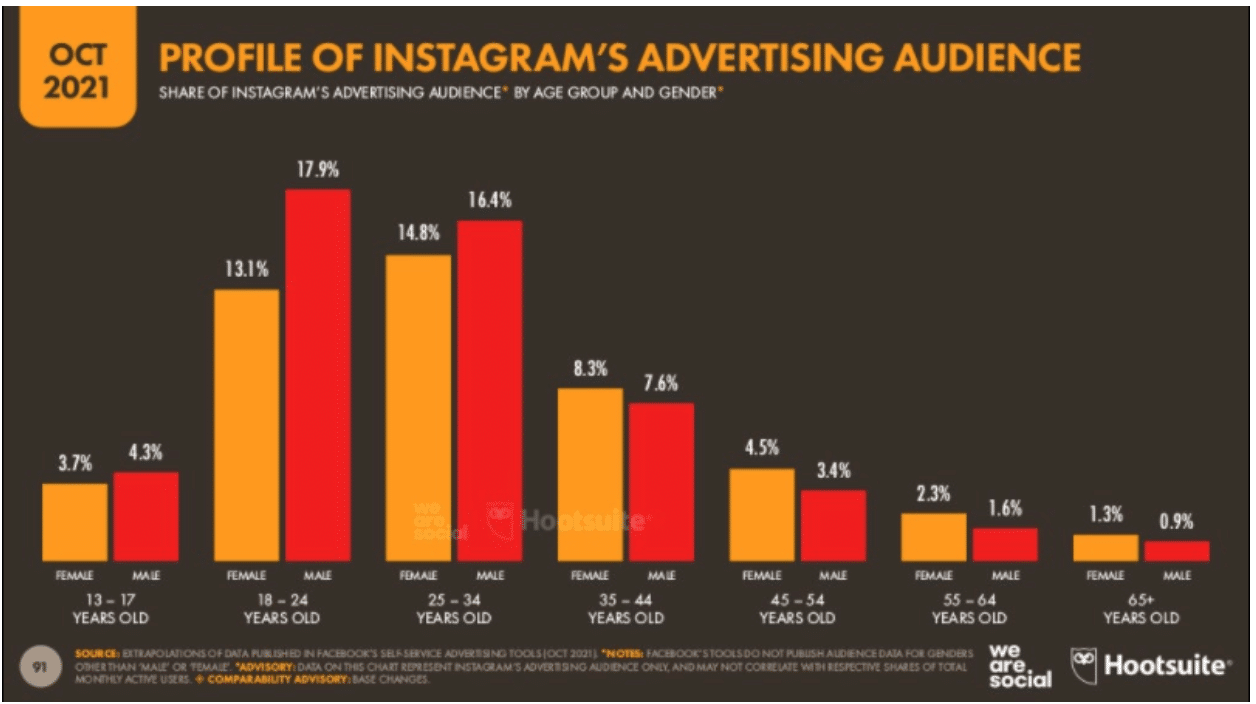
- Most Instagram Users Are 18-34 Years Old
As popular as Instagram is, you might assume that anyone you want to reach is on the platform, but that’s not necessarily true. A whopping 60% of Instagram’s users are between ages 18 and 34. That means this is a fantastic platform if you want to appeal to young adults. By contrast, people over 55 make up just 6% of Instagram’s users, so if you’re trying to appeal to seniors, you may be barking up the wrong tree.
- A Large Percentage of Instagram Users Are Indian
Many people assume the US makes up the largest group of users on Instagram since Instagram is a US-based company, but that isn’t the case. According to Hootsuite, an amazing 201 million Instagram users are in India. The US comes in second place with 157 million. Interestingly, India is also Instagram’s fastest-growing market.
What does this mean for you as a content creator, influencer, or marketer? It means that if you want to build as large of a following as possible, you want to appeal to users in India as well as the US and other countries. The exception is if your brand is only available in a particular country, but otherwise, expand your content to be attention-grabbing and interesting across cultures.
- Most Instagram Users Are on the Platform Daily
In a Pew Research study, 59% of US adults who use Instagram say that they’re on the platform about daily, including 38% who say they’re on Instagram several times per day. This shows the importance of having a steady flow of new content. If you’re only posting every three or four days, either your audience will get bored of seeing the same posts on their newsfeeds or your posts won’t show up at all during many of their visits. It’s best to aim for one or two posts per day to keep them interested.
- Brand Stories Have a High Completion Rate
If you’re not one for posting stories often, it might be time to start because they could garner more views than you expect. A common misconception is that people rarely watch a full story, but some research from Conviva proves that wrong. Brand stories have an outstanding 86% completion rate, and that rate has been rising. Sports stories have a 90% completion rate and it’s 88% for entertainment pages, but the completion rate for brand stories is still very high.
What does this tell you? It means you shouldn’t be shy about posting stories regularly, and that even the slides later in your story are likely to get plenty of visibility. It also gives you a helpful average metric for comparison. If your story completion rate is lower, you could benefit from either shorter stories or more engaging story content.
- People Do Interact with Brands
Another common misconception is that people rarely interact with brands on Instagram. Sure, people typically go to Instagram to keep up with friends and enjoy some entertainment rather than to see ads, but they’re still engaging with brands.
In fact, according to Instagram, one in two Instagram users say they use the platform to discover new brands. Furthermore, two of three users say the platform helps them have meaningful interactions with brands. If you’re marketing a brand on Instagram, that means the platform has high potential for building your brand awareness and brand loyalty.
5 Instagram Statistics to Track in Your Own Instagram Reports
Now that you have some helpful insights into Instagram as a platform and Instagram’s users, let’s talk about your own Instagram performance. What metrics should you be tracking in your Instagram reports to gauge how well you’re doing? There are numerous ways you can analyze Instagram data, but here are the top statistics we recommend.
- Followers
Your number of followers is one of the quickest and most helpful Instagram metrics to track. It tells you how popular your account is and how many people you can reach with each post. It’s as simple as clicking to your profile and seeing how many followers are listed at the top.
There are ways to take this further than a single number or tracking your follower growth. If you have a business profile, you can see the gender breakdown of your followers. This is handy for gauging whether you’re appealing to the people you’re trying to target.
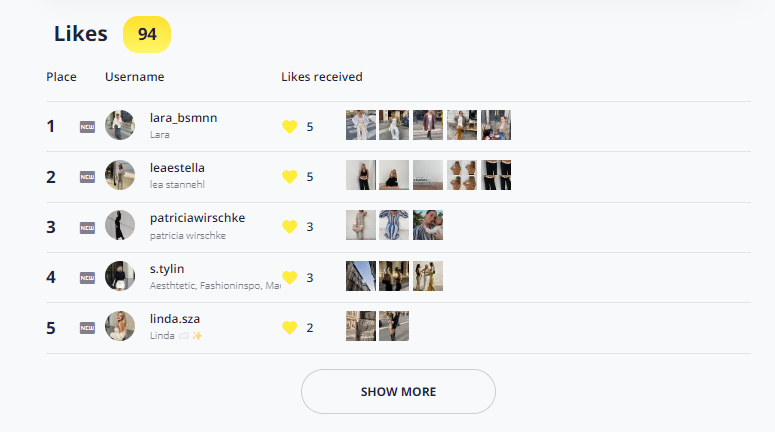
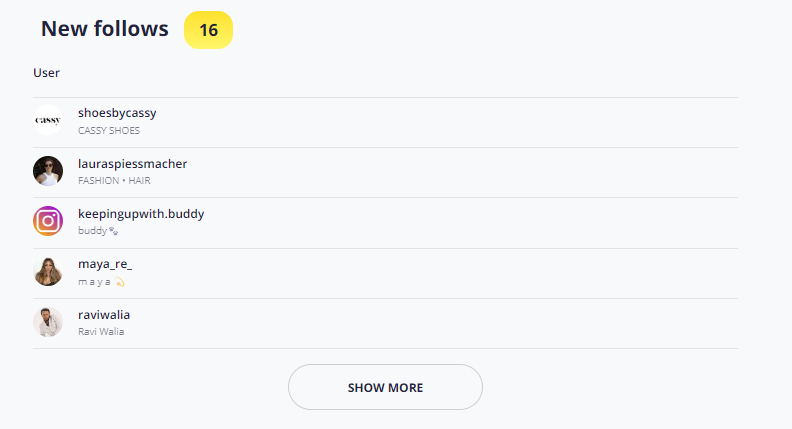
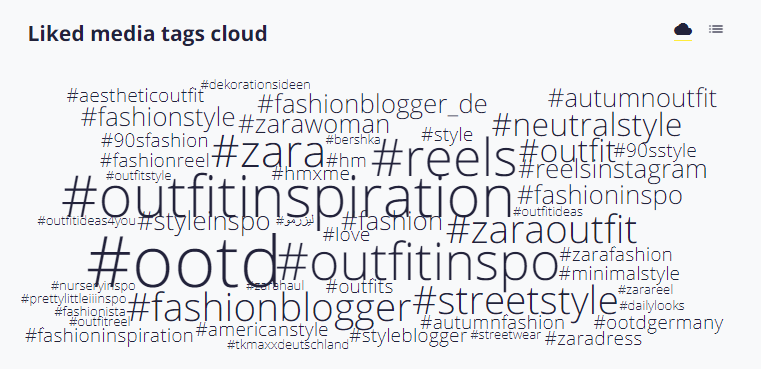
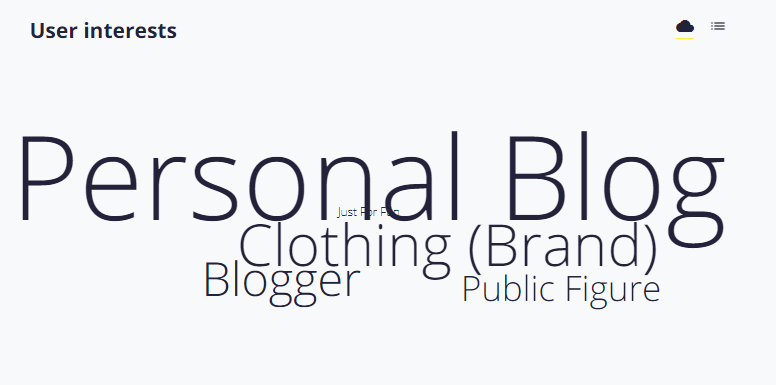
An even more in-depth strategy is to analyze the quality of your followers and use them to optimize your content too. Snoopreport is a tool that lets you track any public Instagram account to see the user’s interactions, what posts they’re liking, and so on.
When you use Snoopreport to track select followers, it tells you how much these users engage with posts and what types of content they engage with most. With that incredibly valuable information in hand, you can create your posts to appeal to those followers because now you know what topics and visuals interest them.
- Impressions
For your Instagram account, your number of impressions is the number of times your posts have shown up in users’ news feeds. On Instagram, for example, you can see your total number of impressions for the past seven days, so you know how many times any of your posts have appeared on users’ news feeds.
Keep in mind that the number of impressions is not the same thing as the number of users who have seen your posts on their news feeds. If one user’s news feed contains two of your posts every day for a week, that’s 14 total impressions but just one user.
You can find your impressions, as long as you have a business profile, by going to your profile and clicking the hamburger menu (the three horizontal lines). Click on “Settings” and then click “Activity.”
- Engagement Rate
Your engagement rate is a bit more complex than your impressions but it’s a more valuable statistic to have too. Your engagement rate for any given post is a percentage that compares the number of followers you have to the number of interactions on the post. Interactions include likes, comments, shares, and saves. Generally, an engagement rate between 1% and 3.5% is considered average to good, and an engagement rate over 6% is very high.
The tricky part is that you have to calculate your own engagement rate because Instagram doesn’t provide this metric. To find the engagement rate for a post, follow these steps:
- Add up the total number of comments, likes, shares, and saves for the post. It doesn’t matter whether one user interacted with the post in multiple ways.
- Divide the total number of interactions by the number of followers you have.
- Multiply that result by 100 to get a percentage.
You can also do this for a collection of posts or for a period of time. To do that, start by adding up all the interactions on all the posts you want to include. Divide that by the number of posts you included to get the average number of interactions per post. Then, use that average and follow the formula above.
- Link Clicks
You probably know that instead of allowing clickable links in post captions, Instagram only allows a clickable link in your bio. The number of people who click that link is a helpful metric to track because it tells you how much traffic you’re driving to your website or other destination.
Fortunately, if you have a business profile, this is a number you don’t have to calculate or find on your own. From your profile, click the hamburger link and click “Insights.” This shows you the bio link clicks for the past week and compares it to the week before so you can see if your clicks are growing, stable, or declining.
- Stories Views
Instagram stories are rife with data. Not only do they tell you who’s watching your story but they give you the total number of views for each story. You can even see the number of views each slide has received so you can see what content is (and isn’t) grabbing and holding your followers’ attention.
All you have to do is check the story to see the number of total views in the bottom left corner below the story. With this, you can compare your various stories and slides to see what types of content are pulling in more views.
Keeping Up with Your Instagram Reports
Steadily and profitably growing your Instagram relies on accurate and strategic data analysis. That might not sound exciting but with the simple stats and Instagram reports above, you can pull together a variety of clues that will help you build a stronger profile. To get started with Instagram reports that tell you all about the top content your followers or target audience members love, learn more about Snoopreport today.